A trendline as a forecast
Seasonality was ignored.
BoldBellowsGoogle Sheets forecasting for teams who plan on a single number they cannot defend
A custom function in Google Sheets runs for at most 30 seconds, while a script runs for up to 6 minutes, so a forecast that needs real work belongs in a scheduled script that writes plain values back, not in a formula that recalculates whenever the sheet is opened. BoldBellows records the data range, the period and the method used before any forecast is written, forecasts from the history in the sheet, flags values that break the pattern with a reason and labels every forecast as an estimate, then builds the forecast in layers: a statistical baseline from the history in your sheet, adjusted for the seasonality it actually finds, a model's reading of notes and known events that may change the picture, a range around each forecast and not a single figure, and anomaly flags on values that fall outside the expected band, each with a short reason and the nearby context, with a clear label that these are estimates and not commitments.
From $960, billed once.
01the single-number problem
A forecast in a spreadsheet is often a trendline dragged to the right, presented as a single number. It ignores seasonality, treats a one-off spike as normal and says nothing about how wrong it might be. Real anomalies hide in columns of numbers until the month-end review, and odd values that are errors get averaged into the history. Adding AI that produces a confident number without showing its working makes the problem worse, not better.
Seasonality was ignored.
Uncertainty was hidden.
Outliers skewed the history.
The same team, planning with numbers they can defend
Before: the copy drifts from Google Sheets
After: a record you can trust
02how it works
What reaches the forecast sheet has passed a rule, a key check and a search.
03The build, piece by piece
Clear is the minimum for live use; Careful and Continuous add the parts that matter once volumes grow.
ClearCarefulContinuous
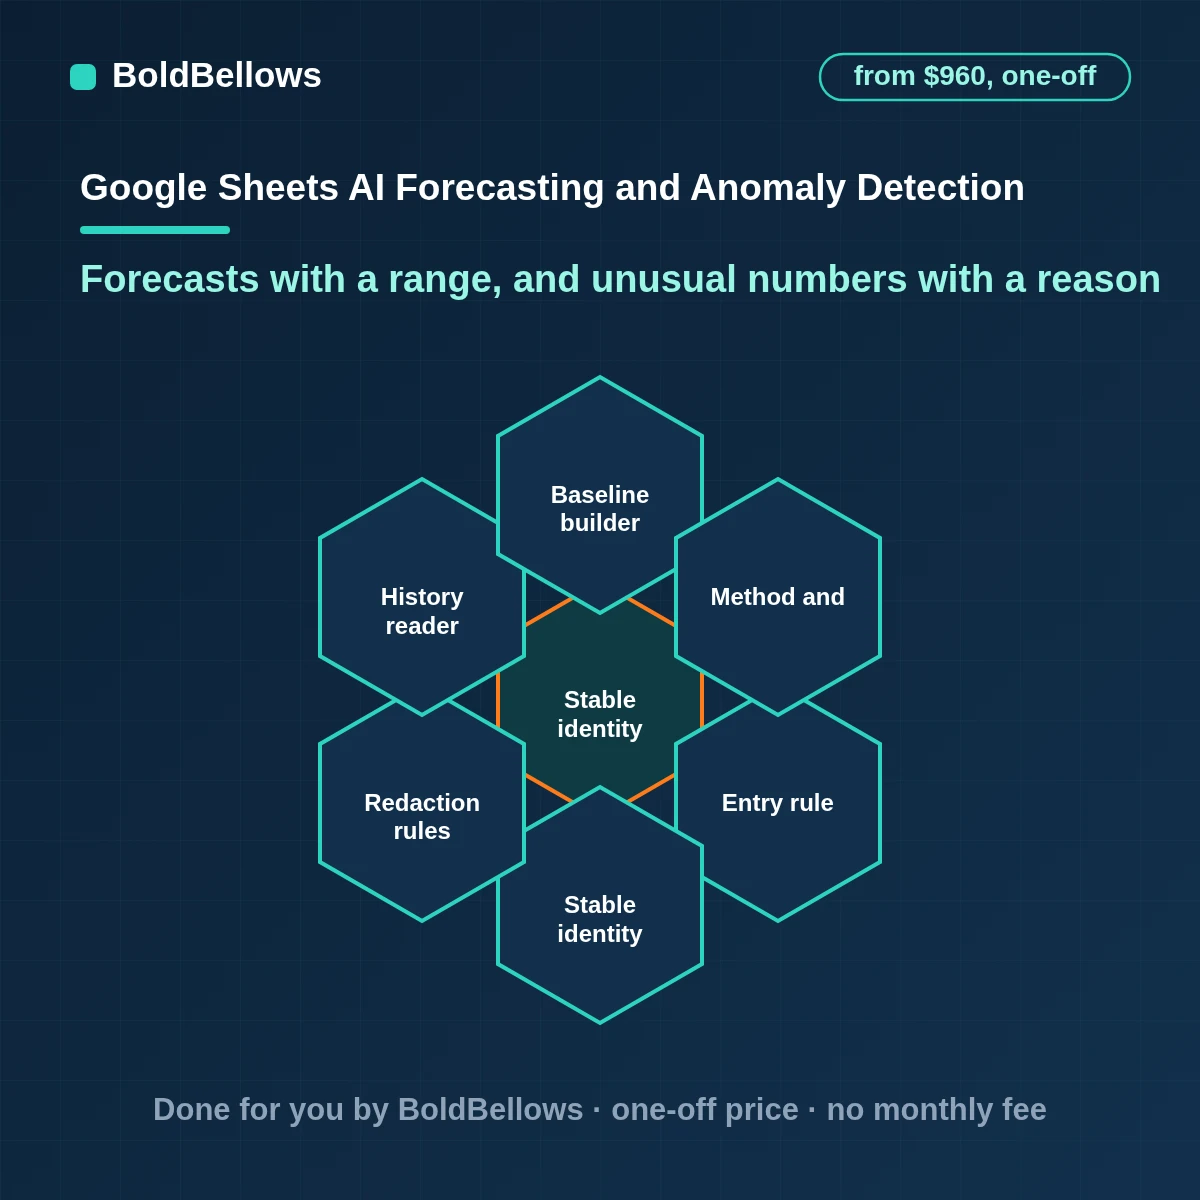
Tests every event against the entry rule and records which clause it passed or failed.
Gives each Google Sheets proposal an identity built from the object, the run and the policy, and saves the verdict beneath it.
Applies redaction rules for sensitive Google Sheets values before anything leaves for the forecast sheet.
Reads the data range and period.
Builds the baseline and seasonal pattern.
Defines methods and known events.
Compares forecasts with what happened.
Lists flagged values and their reasons.
Gives the route owner a short summary of open cases and their ages.
People who want Google Sheets ai forecasting usually ask about Google Sheets forecast function limits and Google Sheets outlier detection too. Related searches include sales forecast Google Sheets, Google Sheets anomaly detection, ai forecasting spreadsheet, Google Sheets ai forecasting and anomaly detection historical migration, Google Sheets seasonal forecast, Google Sheets ai forecasting and anomaly detection, Google Sheets trend forecast, Google Sheets ai forecasting and anomaly detection workflow, Google Sheets ai forecasting and anomaly detection developer, Google Sheets predictive analytics, Google Sheets ai forecasting and anomaly detection cost, Google Sheets forecast automation, apps script forecasting, Google Sheets ai forecasting and anomaly detection specialist, Google Sheets ai forecasting and anomaly detection setup, Google Sheets ai forecasting and anomaly detection optimization, hire Google Sheets ai forecasting and anomaly detection expert, Google Sheets ai forecasting and anomaly detection consultant, Google Sheets ai forecasting and anomaly detection service, Google Sheets ai analysis, Google Sheets ai forecasting and anomaly detection integration, Google Sheets ai forecasting and anomaly detection error handling, Google Sheets ai forecasting and anomaly detection implementation, Google Sheets ai forecasting and anomaly detection agency and Google Sheets ai forecasting and anomaly detection duplicate prevention.
04Who it's for
Planners want a forecast they can defend and a warning when something unusual happens.
"Plan with ranges."
Forecasts show uncertainty.
"Spot problems early."
Anomalies are flagged.
"Trust the outlook."
The method is visible.
"Check the working."
Baselines are documented.
"Set realistic targets."
Seasonality is built in.
"See what changed."
Forecasts are versioned.
05Compare
Each can draw a trendline. Only one shows a range, explains each anomaly and tracks accuracy over time.
| How a forecast starts | A trendline | Unexplained AI numbers | Our forecasting route |
|---|---|---|---|
| What starts the work | Somebody with a spare minute | Events without a qualification step | YesA Google Sheets change matching the route brief |
| How identity is decided | Hunted through both tools | Email alone | YesData range, period forecast and method |
| What reaches the forecast sheet | Whatever seemed important | One row of raw values | YesA ranged forecast, flagged anomalies and an accuracy record |
| After an uncertain result | Left for the next person | Reports an error, nothing more | YesSearches, compares, repairs or hands to a named owner |
A notice that arrives after the record has moved on is logged and closed; the forecast in the forecast sheet stays correct.
The forecast is labeled low confidence with a wide range, seasonality is not claimed, and the note explains what more history would add. The verdict comes from the data range, the period forecast and the method: absent, matching, differing or ambiguous, all recorded. The result is recorded either way, so the decision can be audited.
The data range, the period forecast and the method goes in first, then the mapping, then the branches.
PricingPriced by history, forecasts and anomalies
Work out what the Google Sheets AI route costs in three clicks, with delivery shown beside the figure. It starts at $960.
One setup fee · Range shown first · PDF handover included
View PricingPick a package, answer three short questions about how Google Sheets data should reach AI Forecasting and Anomaly Detection, and your price and turnaround move as you choose.
06The process
No surprises: six steps, with the output of each one agreed in advance.
We read your data for gaps, entry errors and how far back it goes, and say what can honestly be forecast.
Access, model and approvers are settled together: scoped reads in Google Sheets, an approved service and named reviewers.
The method, the range, the anomaly rule and who looks at flags are written out and approved first.
Every path, including the failing ones, is run against a copy of the forecast sheet before production is switched on.
Going live means starting from an agreed record, so nothing is missed or repeated, then handing over the notes.
With Google Sheets AI Forecasting and Anomaly Detection in place, we compare live behavior with the brief and update the handover wherever reality differed.
07Turnaround
The range runs from the day Google Sheets access and the approval path are approved.
6 to 10 business days
10 to 16 business days
16 to 24 business days
08Before we start
09Security and ownership
Everything the model reads from Google Sheets is on a list you approved, and everything it proposes is held until it is cleared.
Every action taken in Google Sheets and the forecast sheet is one their own documentation supports; nothing relies on an unofficial shortcut.
Nothing runs with an administrator's full powers.
Keeping the payload small reduces risk and makes each write to the forecast sheet faster to check and easier to repair.
A retry reconciles what the forecast sheet already holds against what was intended, then writes only the difference.
Retention is short and the content is minimal.
We hand across the map, the checks and the contact points for exceptions.
10In their words
Verified reviews from operations and finance teams who trust BoldBellows to keep their data moving correctly.
AI Data Entry & Reporting Automation
We used to spend hours collecting data and building weekly reports by hand. BoldBellows automated all of it.
The reports are clean, visual and easy to read, and our managers rely on them for quick decisions. Human error is gone and our numbers are more accurate across the board.
AI Workflow Automation for Agencies
Running a digital agency with many clients was overwhelming. BoldBellows built one automation dashboard that tracks tasks, sends updates and creates client reports automatically.
Clients love the transparency and we love the time we get back. Productivity is up, and project delays have dropped to almost zero.
AI Content & Social Media Automation
Our marketing agency couldn’t keep up with content. BoldBellows set up an AI content engine that writes blog posts and captions and even designs our social media creatives.
It spots trends and suggests topics for us, so we stay ahead of competitors. We now produce three times the content with the same team, and engagement has soared. They didn’t just automate our workflow, they lifted our whole brand.
AI Lead Qualification & Sales Automation
Our sales team wasted hours chasing cold leads. BoldBellows built an AI lead-scoring system that reads behavior, email engagement and buying signals.
It filters out weak leads and sends personalized follow-ups automatically, so our team only talks to people who are ready to buy. Conversions rose 40% in the first month. It paid for itself straight away.
AI Video & Voice Automation
We publish product videos every week, and BoldBellows introduced us to AI video automation. The system writes the script, voices it and produces the finished video in minutes.
The quality is remarkable: professional voiceovers, clean visuals and smooth editing. Production time went from three days to under 30 minutes, and we scaled our video marketing without adding cost.
AI Email & Smart Inbox Management
Our inbox used to be chaos. BoldBellows built an AI email system that sorts messages, drafts replies and flags anything urgent.
It learns how we write and gets better every week. We reply faster and no longer miss important messages. It feels like having a personal assistant working around the clock.
AI Booking & Scheduling Automation
Our coaching business needed a better way to schedule. BoldBellows automated all of it: bookings, reminders, cancellations and follow-ups.
No-shows fell by 60% and clients enjoy how smooth it is. It feels personal, not robotic. One of the best upgrades we’ve made.
AI Translation & Localisation
When we expanded abroad we needed fast, accurate translations. BoldBellows built an AI translation system that turns our content into several languages instantly.
The translations read naturally and suit each culture. We now serve customers in five new countries without hiring translators. BoldBellows helped us go global.
AI HR & Recruitment Automation
Our HR team was drowning in applications. BoldBellows automated screening, skills-based filtering and interview scheduling.
It saves us hours every week and means we only interview qualified people. Hiring is now faster, better organized and more professional.
AI Chatbot & Customer Support
BoldBellows built an AI support chatbot for our online boutique, and it has changed how we run the business. We used to have two full-time staff answering the same questions all day. Now the AI handles order tracking, product recommendations and even refund requests on its own.
What surprised me most is how natural it sounds. Customers compliment the ‘agent’ without realizing it’s AI. Our support workload dropped by 75% and customer satisfaction went up dramatically.
AI Accounting & Invoice Automation
BoldBellows automated our whole invoicing process: creating invoices, sending reminders and tracking payments.
Late payments dropped sharply, and our accounting team finally has time for strategy instead of repetitive admin. Worth every penny.
AI E-commerce Listings Automation
BoldBellows automated our product listings. The AI writes descriptions, organizes photos and publishes listings across several marketplaces.
It even answers customer questions instantly. Our store looks more professional and sales have noticeably increased.
AI Customer Journey Automation
We wanted a smoother path from first contact to purchase. BoldBellows built an AI system that guides each customer there automatically.
It sends personalized messages, recommends products and follows up at just the right moment. Customer retention has improved dramatically.
AI Document & Contract Automation
Onboarding was slow because we wrote every contract by hand. BoldBellows automated the lot: contracts, welcome emails and client setup.
What took 48 hours now takes under 10 minutes, and clients regularly tell us how professional it feels.
AI Social Comment & DM Automation
We get thousands of comments and messages every week. BoldBellows built an AI system that replies instantly, filters spam and surfaces the important ones.
Engagement is up and our page looks active around the clock. It’s like having a full social media team that never stops.
AI CRM Automation
Our CRM was barely used because updating it by hand was tedious. BoldBellows automated data entry, tagging, segmentation and follow-ups.
Now the CRM is always up to date and our campaigns are far more accurate. It improved our whole sales pipeline.
AI Voice Assistant
BoldBellows built a custom AI voice assistant for our customer hotline. It answers questions, books appointments and handles simple requests.
Customers love how fast it is, and our call-centre workload dropped dramatically. One of the smartest upgrades we’ve made.
AI Automation Partner
BoldBellows is hands-down the best AI automation partner we’ve worked with. Their systems are fast, reliable and built around how our business actually works.
Every automation they’ve delivered, from customer service to content, runs flawlessly. We’ve saved time, cut costs and grown faster than we expected.
11FAQ
Clear replies to the concerns that come up in almost every conversation.
A zap delivers forecasts that show a range and unusual values that come with a reason. It leaves you to forecast with limited history, spot a real anomaly or avoid false certainty. It is that layer the packages price.
Enough to show the pattern; we say if not.
No, it is a labeled estimate.
Because uncertainty is real.
A value outside the expected band.
Yes, beside each flag.
Yes, against what happened.
It is never extra: every package includes the Google Sheets field map and your sign-off on it.
Yes. Tell us how your Google Sheets work divides and the route will follow it, from $960.
Every interface is named in the notes. A change upstream halts the affected step and raises a flag, so nothing wrong is written. Later repair work is quoted separately. This page also answers searches for custom google sheets ai forecasting and anomaly detection.
Next stepForecast from Google Sheets with a range you can defend
Tell us how decisions are made in Google Sheets today and we will build the route around it, from $960.
Custom scope is available; describe it in your quote request.