Clicks gone after a month
They were never stored.
BoldBellowsTwitter/X analytics reporting automation for brands that report on organic performance
Public metrics such as likes, replies, reposts and impressions can be read for any post, but URL clicks, profile clicks and engagements exist only for the owner's posts from the last 30 days. BoldBellows stores the post ID with the queue entry it was created from, reads the post once, because every extra read is billed per resource, then reads your own timeline, which is billed at $0.001 per resource instead of $0.005, snapshots each post's metrics on the days you choose, stores them in a table you own and compiles a weekly report with the movement from the week before.
From $975, billed once.
01the vanishing-numbers problem
URL clicks, profile clicks and engagements are available only for posts from the last 30 days, so a quarterly review finds the early weeks gone. The screen cannot be scheduled, exports are manual, and a team that tries to build its own reader discovers that general post reads cost five times the owned rate, and that reading the same post twice in a UTC day does not make the number any more current.
They were never stored.
Nothing was scheduled.
Numbers were copied.
The same account, with numbers that last
Before: the copy drifts from Twitter/X
After: a record you can trust
02how it works
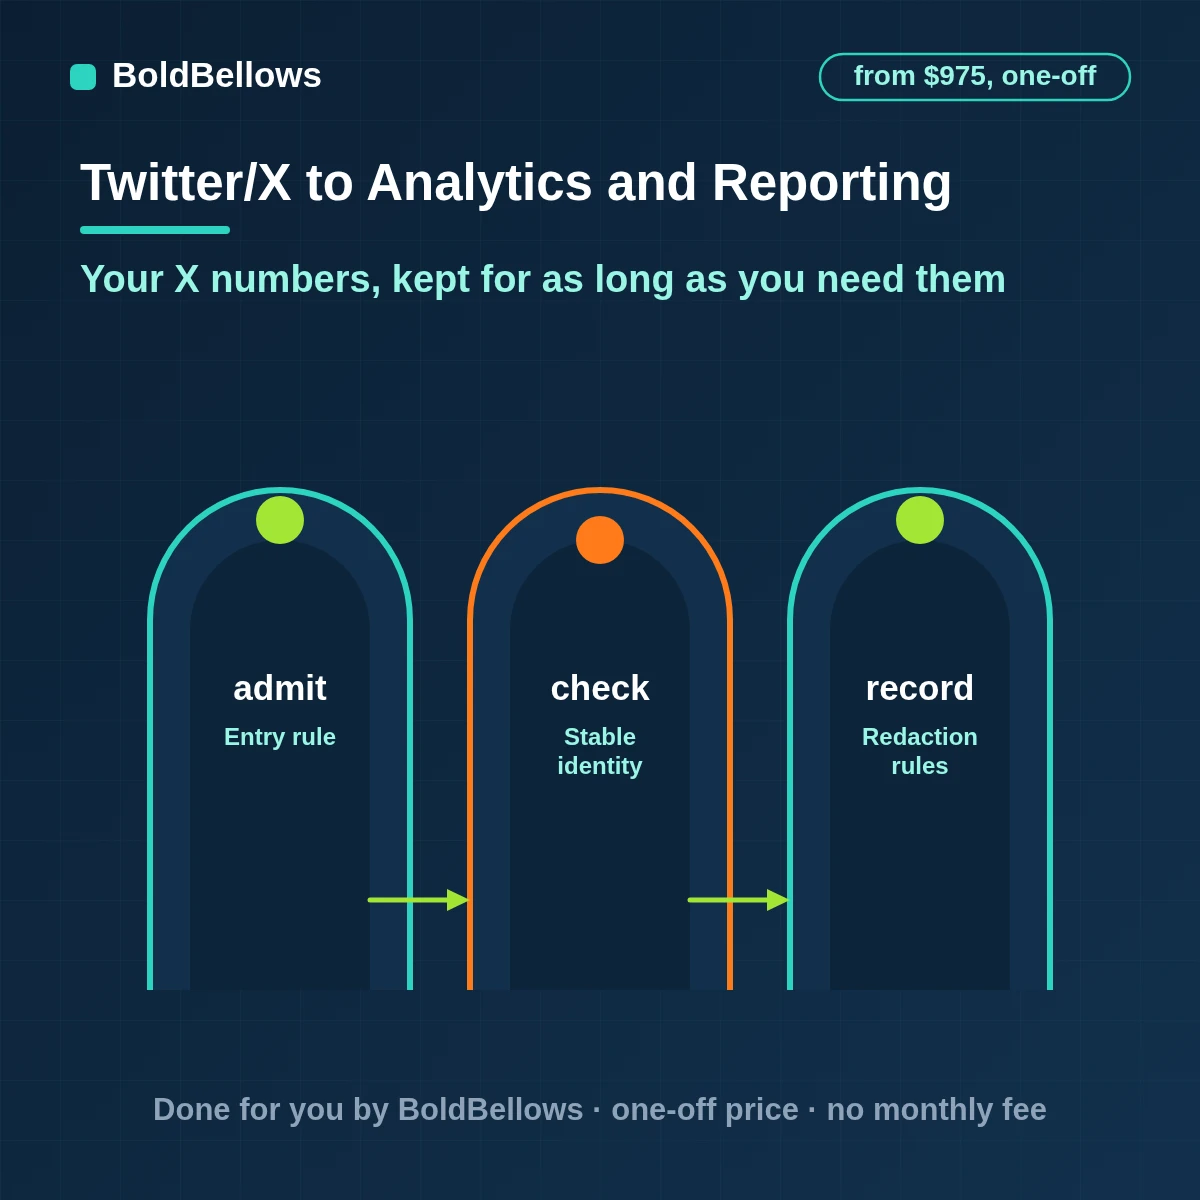
What reaches reports has passed a rule, a key check and a search.
03The build, piece by piece
Clear is the minimum for live use; Careful and Continuous add the parts that matter once volumes grow.
ClearCarefulContinuous
Tests every event against the entry rule and records which clause it passed or failed.
Remembers which Analytics and Reporting item came from which Twitter/X record, and when it last changed.
Applies redaction rules for sensitive Twitter/X values before anything leaves for reports.
Stores each post's metrics for the day and builds the weekly report.
Classifies each arrival against the account, the post ID and the snapshot date, leaving ambiguity to a named owner.
Decides which metrics, intervals and alert thresholds apply to each account.
Turns silent drift between Twitter/X and reports into a short, dated worklist.
Flags a metric the API has renamed, removed or begun to return differently.
Gives the route owner a short summary of open cases and their ages.
Looking into store twitter analytics beyond 30 days? The same brief covers twitter/x analytics and reporting duplicate prevention and twitter analytics automation. Related searches include twitter/x analytics and reporting error handling, twitter/x analytics and reporting consultant, twitter analytics automation service, twitter analytics export automatically, twitter analytics reporting automation, twitter/x analytics and reporting historical migration, x API analytics dashboard, social media analytics automation x, twitter analytics automation setup, weekly twitter report automation, x analytics automated report, twitter analytics automation integration, twitter metrics history and twitter/x analytics and reporting implementation.
04Who it's for
X holds the numbers for 30 days at most. Your reports need them for much longer.
"I need a quarter, not a week."
Daily snapshots build a record beyond the 30-day limit.
"I want the clicks."
Non-public metrics are captured while they are available.
"Clients ask for a PDF."
With Twitter/X Analytics and Reporting in place, the weekly report goes out on a schedule.
"What is the read bill?"
Reads are logged at the owned rate and totalled.
"Show me spikes."
A threshold alert names the post that moved.
"I want the headline."
With Twitter/X Analytics and Reporting in place, the report opens with the three changes that matter.
05Compare
Each can show a number today. Only one stores it, compares it and reports it at the cheapest price.
| What opens the run | the native analytics screen | A free-form reports zap | BoldBellows, centred on a snapshot-and-report route |
|---|---|---|---|
| What starts the work | Somebody with a spare minute | Events without a qualification step | YesA post event matching the route brief |
| How identity is decided | Hunted through both tools | Email alone | YesOne key: account, post ID and snapshot date |
| What reaches reports | Whatever seemed important | One row of raw values | YesA dated snapshot per post, stored beyond the window and reported weekly |
| After an uncertain result | Left for the next person | Reports an error, nothing more | YesSearches, compares, repairs or hands to a named owner |
A notice that arrives after the record has moved on is logged and closed; the report row in reports stays correct.
The snapshot taken on day 29 captured the clicks while the metric was still available, so the quarterly report can show them after the API has stopped returning them. The verdict comes from the account, the post ID and the snapshot date: absent, matching, differing or ambiguous, all recorded. The result is recorded either way, so the decision can be audited.
The account, the post ID and the snapshot date goes in first, then the mapping, then the branches.
PricingPriced by snapshots, reports and thresholds
The Clear package begins at $975 and nothing is billed afterwards.
One setup fee · Range shown first · PDF handover included
View PricingPick a package, answer three short questions about how Twitter/X data should reach Analytics and Reporting, and your price and turnaround move as you choose.
06The process
No surprises: six steps, with the output of each one agreed in advance.
We agree the metrics, the intervals and the accounts, and where the snapshots will be stored.
We link Twitter/X and Analytics and Reporting through supported interfaces and record exactly what each connection can do.
In the Twitter/X Analytics and Reporting service, the report layout, the recipients and the thresholds for alerts are agreed in writing before the first snapshot.
Every path, including the failing ones, is run against a copy of reports before production is switched on.
Launch is a checkpoint, not a cliff: the route starts from a known point and the notes arrive with it.
With Twitter/X Analytics and Reporting in place, we compare live behaviour with the brief and update the handover wherever reality differed.
07Turnaround
Timing begins when both connections are approved, in the Twitter/X Analytics and Reporting service.
6 to 10 business days
10 to 16 business days
16 to 24 business days
08Before we start
09Security and ownership
Scope is deliberately narrow: approved Twitter/X fields in, one Analytics and Reporting destination out, no side stores.
Every action taken in Twitter/X and reports is one their own documentation supports; nothing relies on an unofficial shortcut.
Tokens cover only the named objects and can be revoked whenever you choose.
Keeping the payload small reduces risk and makes each write to reports faster to check and easier to repair.
A retry reconciles what reports already holds against what was intended, then writes only the difference.
We record what happened and when, never the private details of your records.
Everything we built is documented and belongs to your team.
10In their words
Verified reviews from operations and finance teams who trust BoldBellows to keep their data moving correctly.
AI Customer Journey Automation
We wanted a smoother path from first contact to purchase. BoldBellows built an AI system that guides each customer there automatically.
It sends personalized messages, recommends products and follows up at just the right moment. Customer retention has improved dramatically.
AI Data Entry & Reporting Automation
We used to spend hours collecting data and building weekly reports by hand. BoldBellows automated all of it.
The reports are clean, visual and easy to read, and our managers rely on them for quick decisions. Human error is gone and our numbers are more accurate across the board.
AI Automation Partner
BoldBellows is hands-down the best AI automation partner we’ve worked with. Their systems are fast, reliable and built around how our business actually works.
Every automation they’ve delivered, from customer service to content, runs flawlessly. We’ve saved time, cut costs and grown faster than we expected.
AI Chatbot & Customer Support
BoldBellows built an AI support chatbot for our online boutique, and it has changed how we run the business. We used to have two full-time staff answering the same questions all day. Now the AI handles order tracking, product recommendations and even refund requests on its own.
What surprised me most is how natural it sounds. Customers compliment the ‘agent’ without realizing it’s AI. Our support workload dropped by 75% and customer satisfaction went up dramatically.
AI Content & Social Media Automation
Our marketing agency couldn’t keep up with content. BoldBellows set up an AI content engine that writes blog posts and captions and even designs our social media creatives.
It spots trends and suggests topics for us, so we stay ahead of competitors. We now produce three times the content with the same team, and engagement has soared. They didn’t just automate our workflow, they lifted our whole brand.
AI Lead Qualification & Sales Automation
Our sales team wasted hours chasing cold leads. BoldBellows built an AI lead-scoring system that reads behavior, email engagement and buying signals.
It filters out weak leads and sends personalized follow-ups automatically, so our team only talks to people who are ready to buy. Conversions rose 40% in the first month. It paid for itself straight away.
AI Video & Voice Automation
We publish product videos every week, and BoldBellows introduced us to AI video automation. The system writes the script, voices it and produces the finished video in minutes.
The quality is remarkable: professional voiceovers, clean visuals and smooth editing. Production time went from three days to under 30 minutes, and we scaled our video marketing without adding cost.
AI Email & Smart Inbox Management
Our inbox used to be chaos. BoldBellows built an AI email system that sorts messages, drafts replies and flags anything urgent.
It learns how we write and gets better every week. We reply faster and no longer miss important messages. It feels like having a personal assistant working around the clock.
AI Workflow Automation for Agencies
Running a digital agency with many clients was overwhelming. BoldBellows built one automation dashboard that tracks tasks, sends updates and creates client reports automatically.
Clients love the transparency and we love the time we get back. Productivity is up, and project delays have dropped to almost zero.
AI Booking & Scheduling Automation
Our coaching business needed a better way to schedule. BoldBellows automated all of it: bookings, reminders, cancellations and follow-ups.
No-shows fell by 60% and clients enjoy how smooth it is. It feels personal, not robotic. One of the best upgrades we’ve made.
AI Translation & Localisation
When we expanded abroad we needed fast, accurate translations. BoldBellows built an AI translation system that turns our content into several languages instantly.
The translations read naturally and suit each culture. We now serve customers in five new countries without hiring translators. BoldBellows helped us go global.
AI HR & Recruitment Automation
Our HR team was drowning in applications. BoldBellows automated screening, skills-based filtering and interview scheduling.
It saves us hours every week and means we only interview qualified people. Hiring is now faster, better organized and more professional.
AI Accounting & Invoice Automation
BoldBellows automated our whole invoicing process: creating invoices, sending reminders and tracking payments.
Late payments dropped sharply, and our accounting team finally has time for strategy instead of repetitive admin. Worth every penny.
AI E-commerce Listings Automation
BoldBellows automated our product listings. The AI writes descriptions, organizes photos and publishes listings across several marketplaces.
It even answers customer questions instantly. Our store looks more professional and sales have noticeably increased.
AI Document & Contract Automation
Onboarding was slow because we wrote every contract by hand. BoldBellows automated the lot: contracts, welcome emails and client setup.
What took 48 hours now takes under 10 minutes, and clients regularly tell us how professional it feels.
AI Social Comment & DM Automation
We get thousands of comments and messages every week. BoldBellows built an AI system that replies instantly, filters spam and surfaces the important ones.
Engagement is up and our page looks active around the clock. It’s like having a full social media team that never stops.
AI CRM Automation
Our CRM was barely used because updating it by hand was tedious. BoldBellows automated data entry, tagging, segmentation and follow-ups.
Now the CRM is always up to date and our campaigns are far more accurate. It improved our whole sales pipeline.
AI Voice Assistant
BoldBellows built a custom AI voice assistant for our customer hotline. It answers questions, books appointments and handles simple requests.
Customers love how fast it is, and our call-centre workload dropped dramatically. One of the smartest upgrades we’ve made.
11FAQ
What to know before choosing a package, in plain language.
A zap delivers numbers that survive the thirty-day window. It leaves you to keep impressions and clicks past 30 days, avoid paying general read rates for your own posts or compare accounts on one basis. It is that layer the packages price.
It shows today's numbers, cannot be scheduled and loses non-public metrics after 30 days.
Your own posts are billed at $0.001 per resource, and repeats inside a UTC day are charged once.
Likes, replies, reposts, quotes, bookmarks and impressions, plus clicks and engagements for your own recent posts.
Yes. Every account is read and stored the same way, so the comparison is fair.
In a Google Sheet, Airtable base or database you own.
No. It only reads and reports.
Yes. The Twitter/X Analytics and Reporting field mapping service is where we agree formats, required values and owner rules before any build work starts.
Yes. Our packages assume a custom Twitter/X workflow for Analytics and Reporting, and the consultancy is included: a Twitter/X Analytics and Reporting integration consultant on your side from $975.
The safest reaction to change is to stop and report, so that is what the route does. Ongoing maintenance beyond the review period is separate.
Next stepKeep your X numbers for as long as you need them
To automate Twitter/X data to Analytics and Reporting with us starts at $975.
For complex estates, a written custom quote comes first.